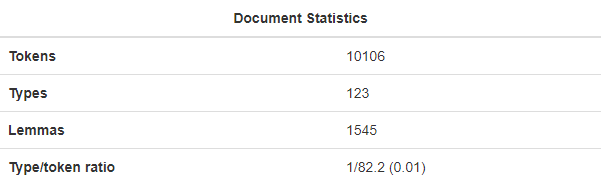
Document Statistics
The Document View can be extended with an extra tab that can display various statistics about the document, such as the number of tokens, types, lemmas, and more. These are disabled by default, but you can plug in some functions to generate this data.
Enabling any of these will show a new Statistics tab next to the default Content and Metadata tabs.
WARNING
These functions are only available on the /docs/ page, not the /search/ page!
Make sure you check for availability, or add the page="article" attribute to your custom JS in search.xml to ensure it only runs on the /docs/ page.
Custom Statistics Table
You may provide a function with the signature (BLDocument, BLHitSnippet) => { [key: string]: string; } (see blacklabTypes for type definitions):
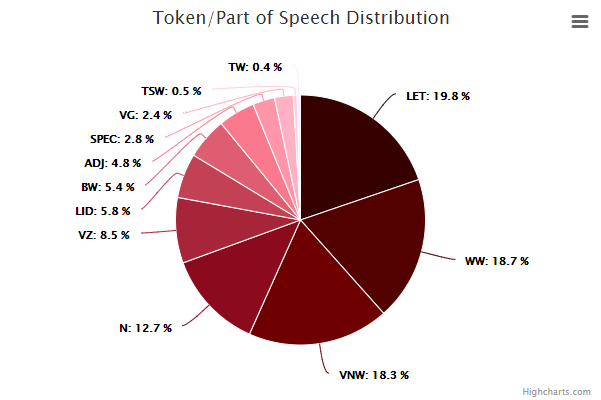
Pie Chart: Annotation Value Frequency
Display the frequency of an annotation's values as a pie chart:
Growth Graph: Annotation Growth Over Document
Show the growth of annotations in the document:
- The number of unique values on the y-axis
- The number of tokens so far on the x-axis
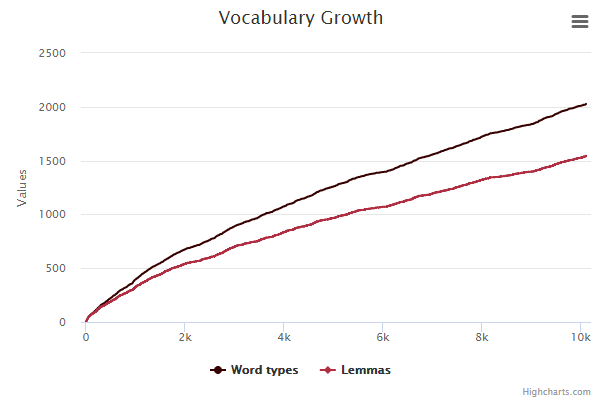
Chart Color Palette
If you're using custom CSS, you can set the color palette to help charts blend in with your style. By default, the color is Bootstrap 3 primary blue (#337ab7).
javascript
vuexModules.root.actions.baseColor('#9c1b2e');